The MAIA project
Combining my interests for programming and yachting has pushed me towards developing a system to use on my yacht as a supplement to the existing but rather old instruments on board.
I have been a programmer hobbyist for many years starting with basic and later on Visual Basic. I bought my first Raspberry Pi (RPi) back in 2012 and stepped on the Python train developing applications for home use such as an alarm system and a weather station etc.
When I bought a yacht in 2016 that was equipped with instruments using the Raymarine Seatalk1 bus I started exploring how to integrate this with RPi but it turned out to be incompatible with the RPi without a converter unit due to Raymarine’s odd serial protocol. However I started developing a maritime system acquiring data from a GPS attached to the USB port of a RPi3 so I had the options of handling and displaying some data independent of the instruments. Later on a Sense-HAT was added as a supplement, but it didn’t provide reliable temperature readings.
My newest yacht that I bought in 2020 also use the ST1 protocol. Luckily it has a NMEA0183 converter which provides a standard serial output so I could start the process of combining instrument data with as many parameters that I can pick up on board. Today this counts more than 20 different live data streams that all give information during planning and sailing.
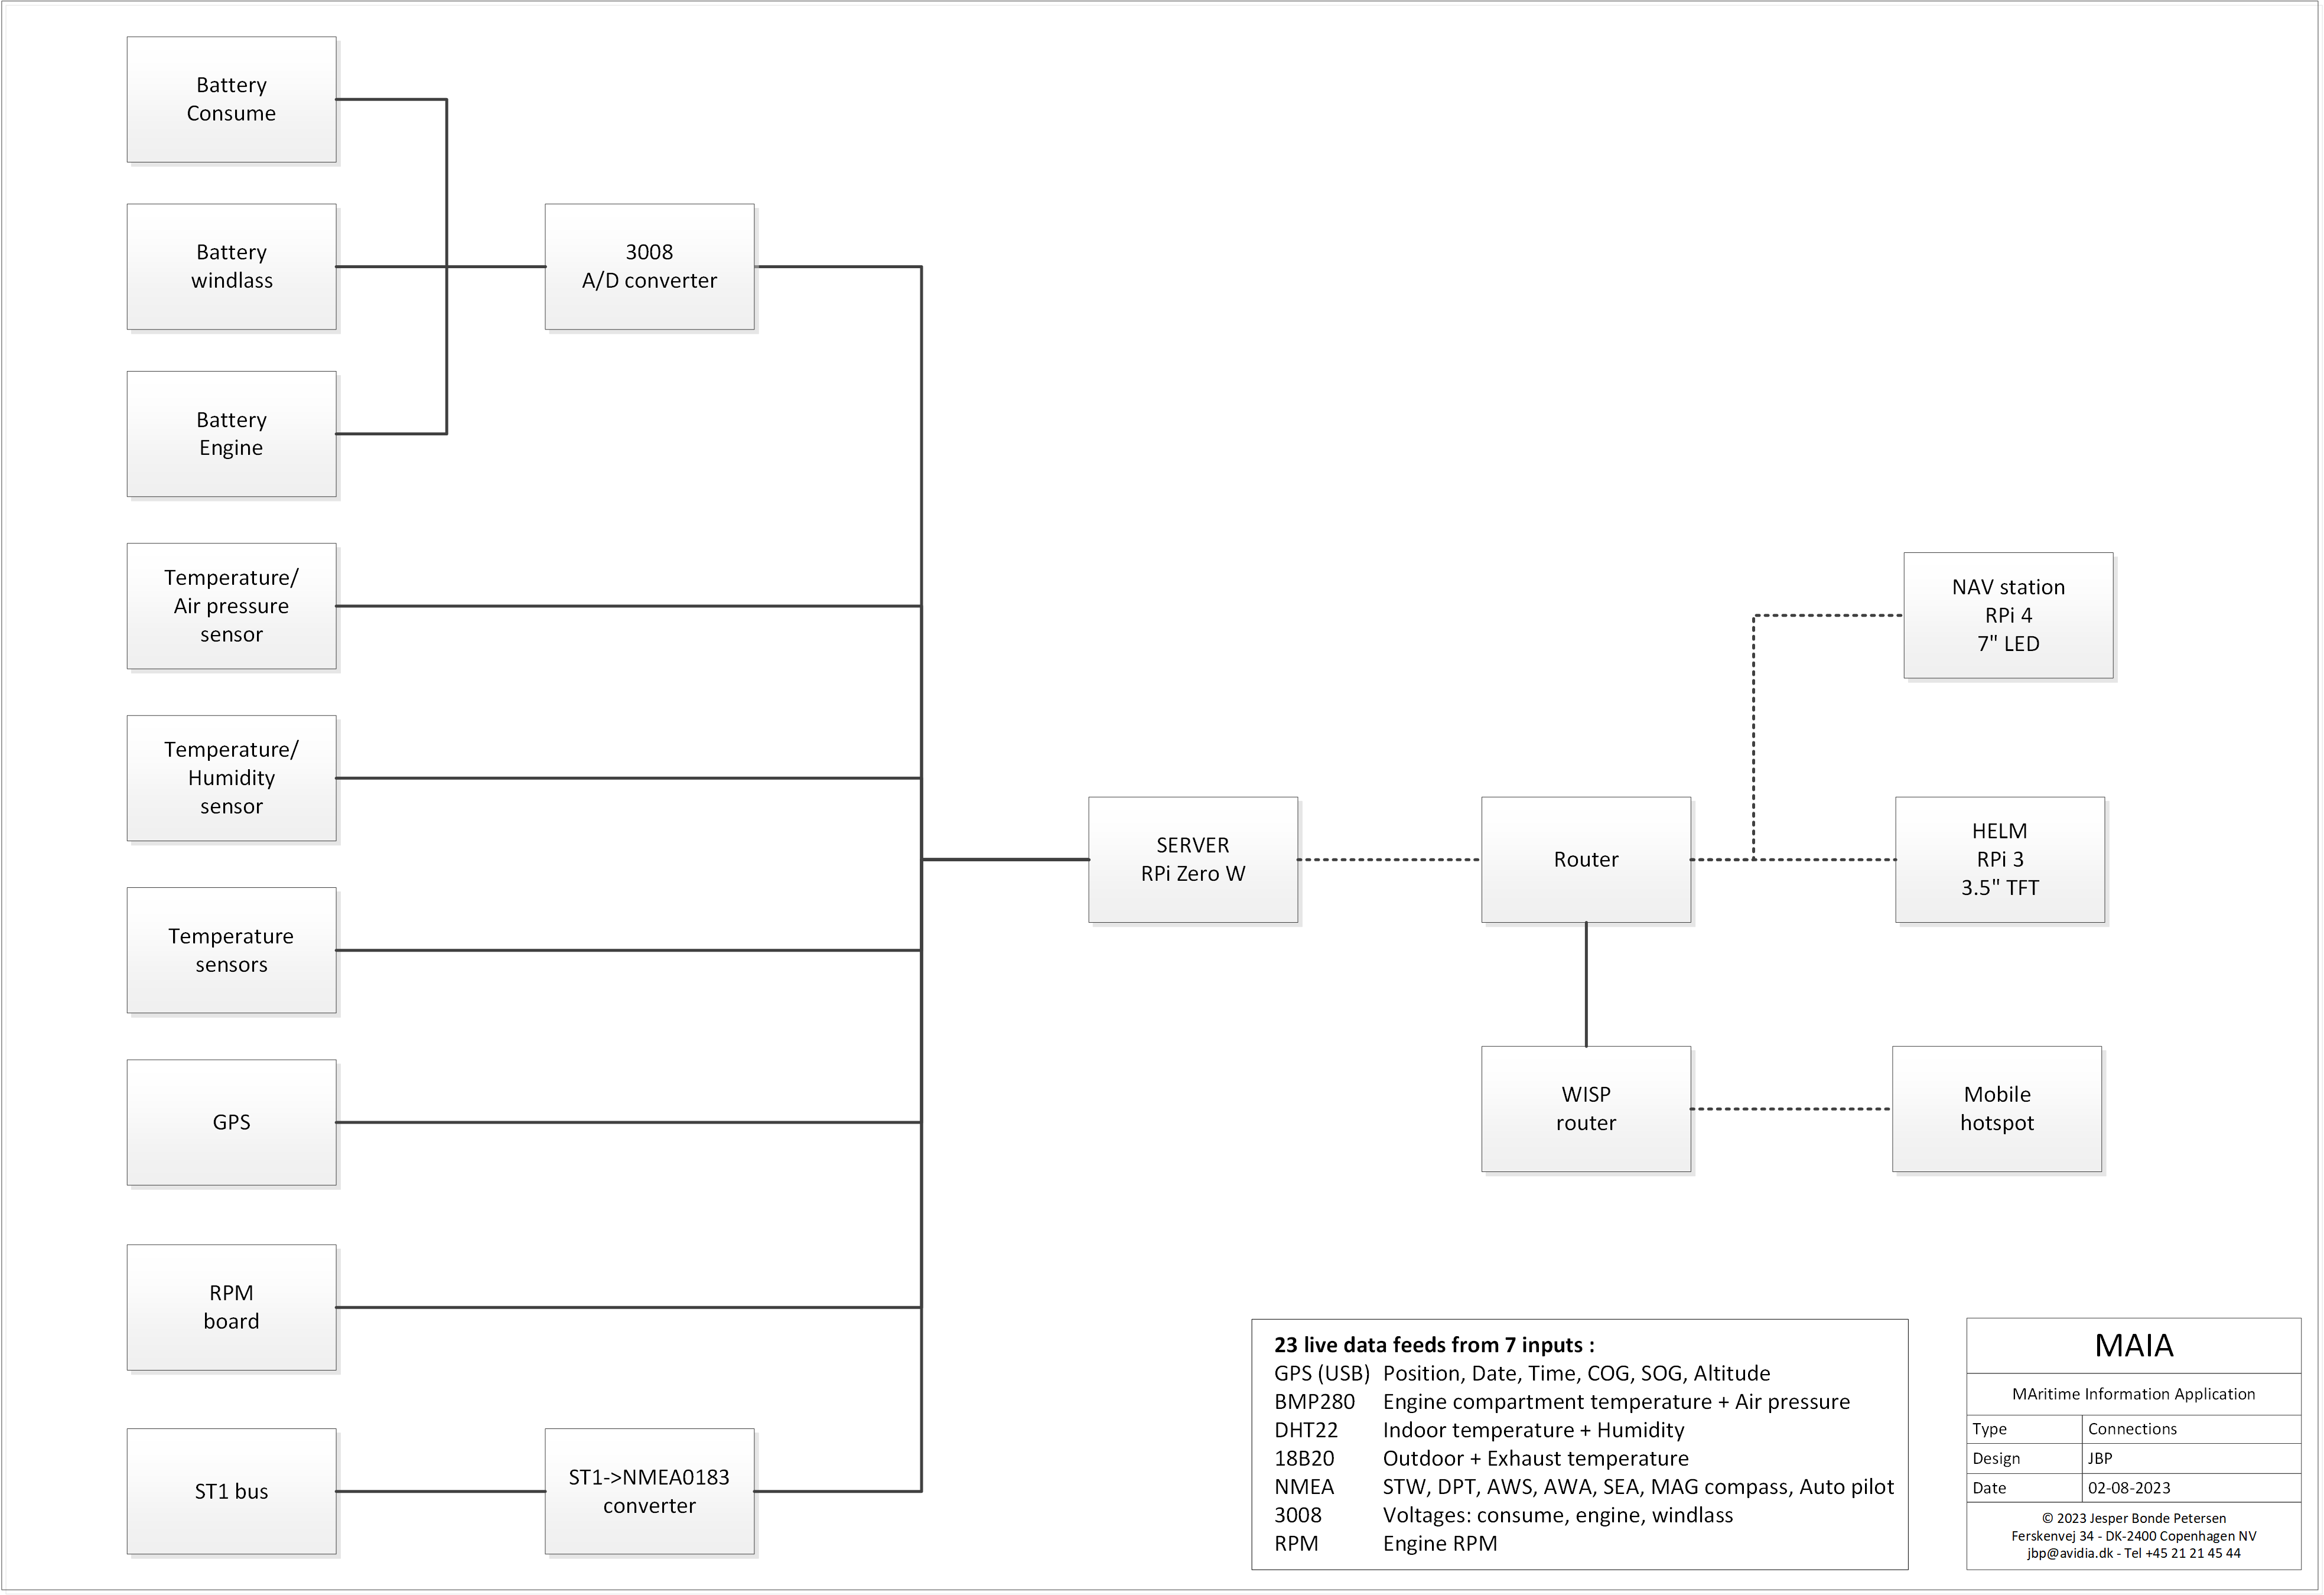
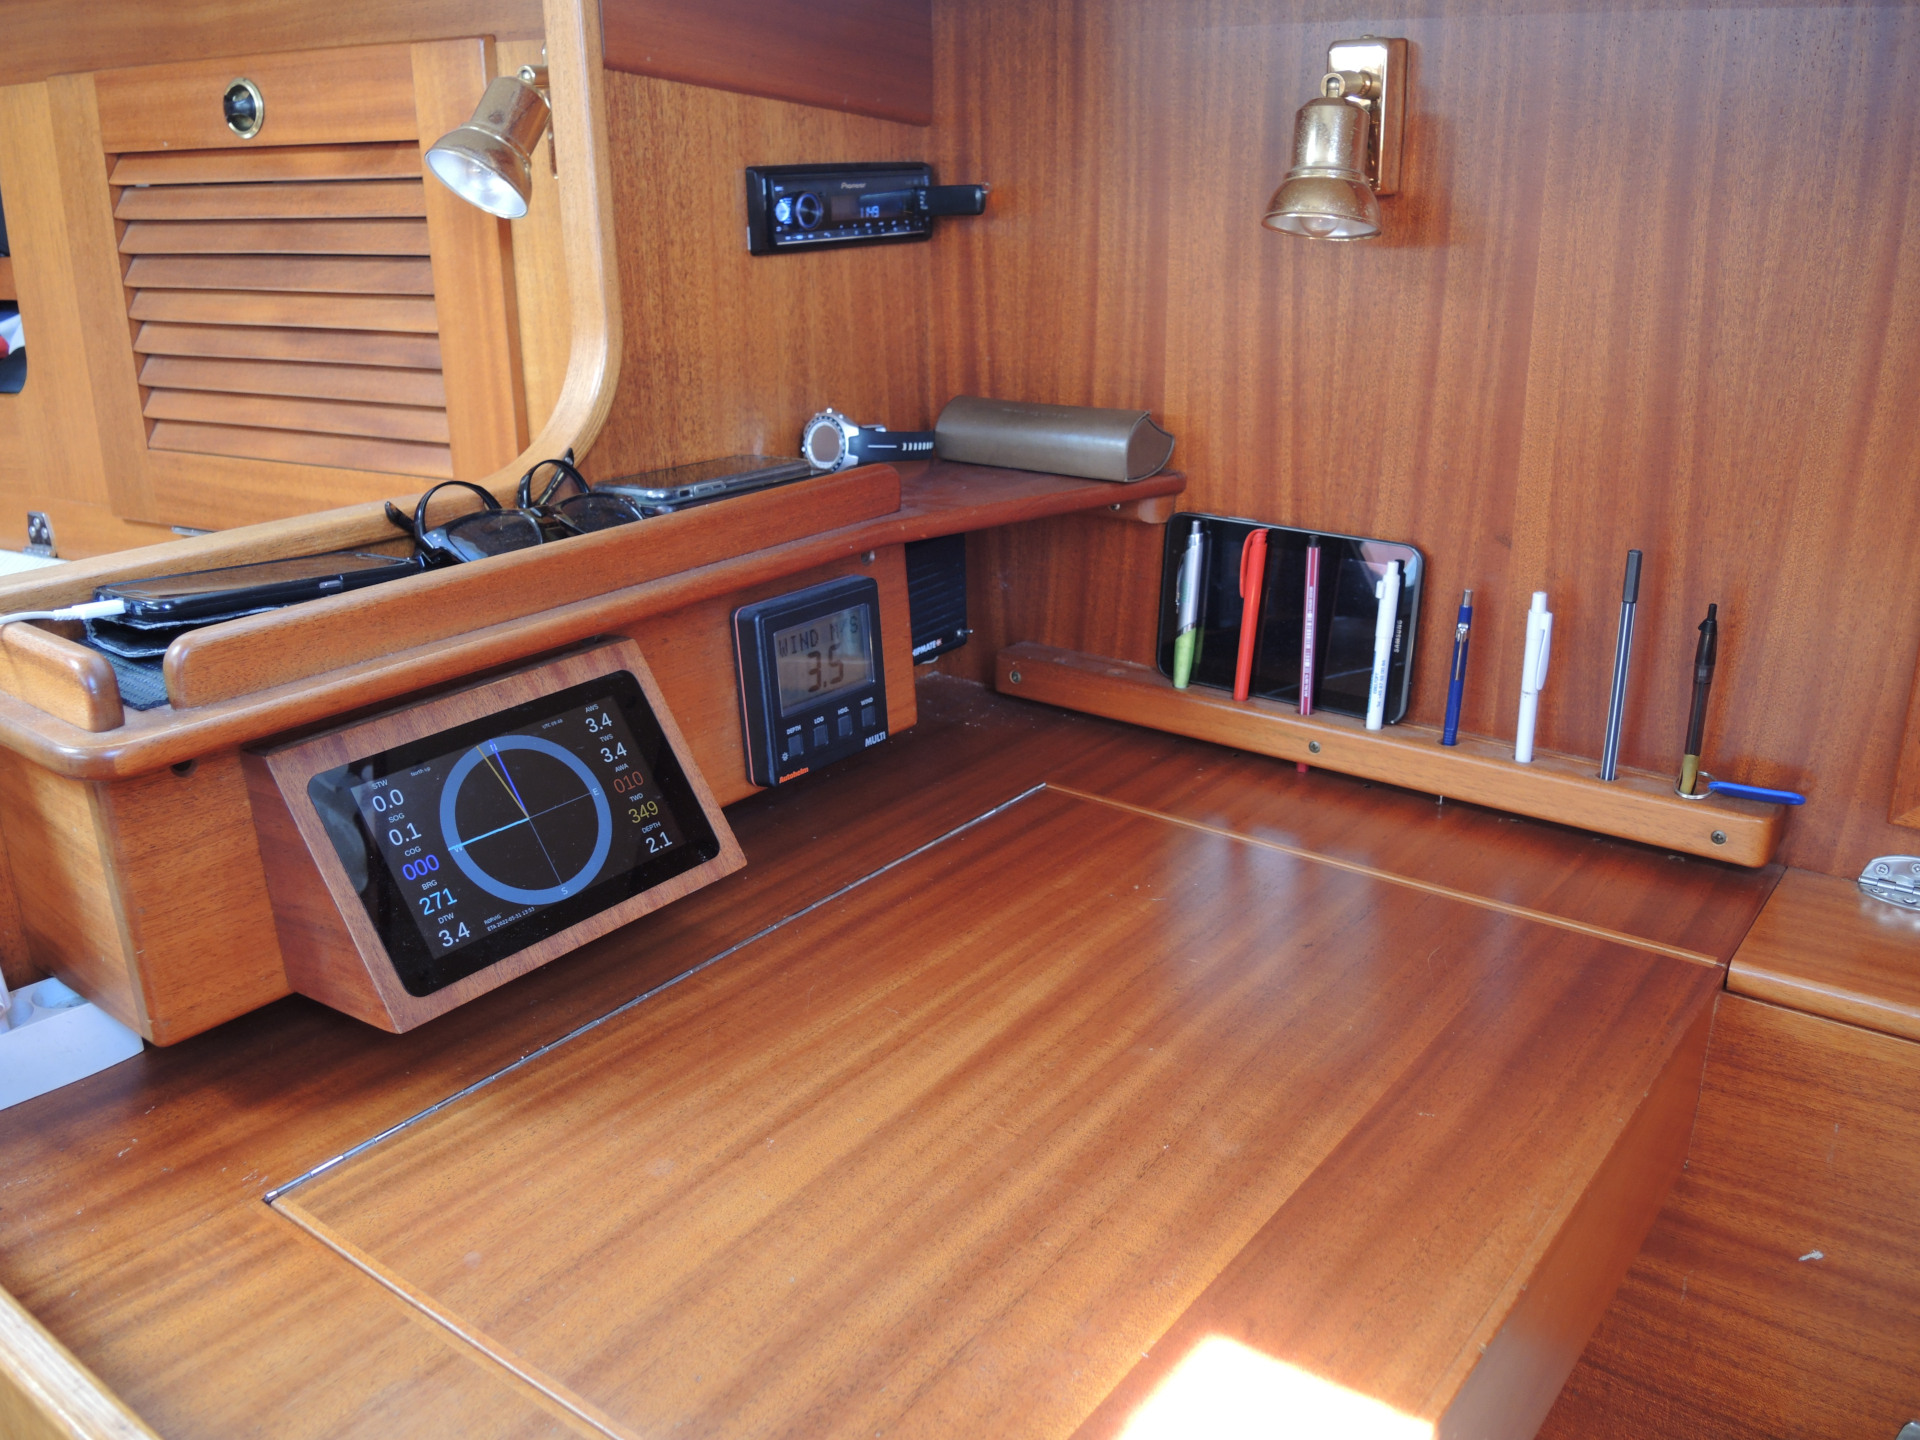
I have named the system MAIA (MAritime Information Application) and currently the system consists of a RPi Zero W acting as a server and two RPi clients that are used for display as seen here:
Thus MAIA can be used as a supplement to plotters or mobile navigation devices in order to optimize overview of yacht data from instruments and GPS but also for providing additional information and features.
The client software is designed for small touch screens and all menus provide an intuitive user interface which enables quick and easy access to information during sailing through a simple layout that is clearly visible even on the smallest screens. So for someone like me carrying older instruments on board and use tablets for navigation, the MAIA system now adds all the extra overview and flexibility that new and expensive systems have.
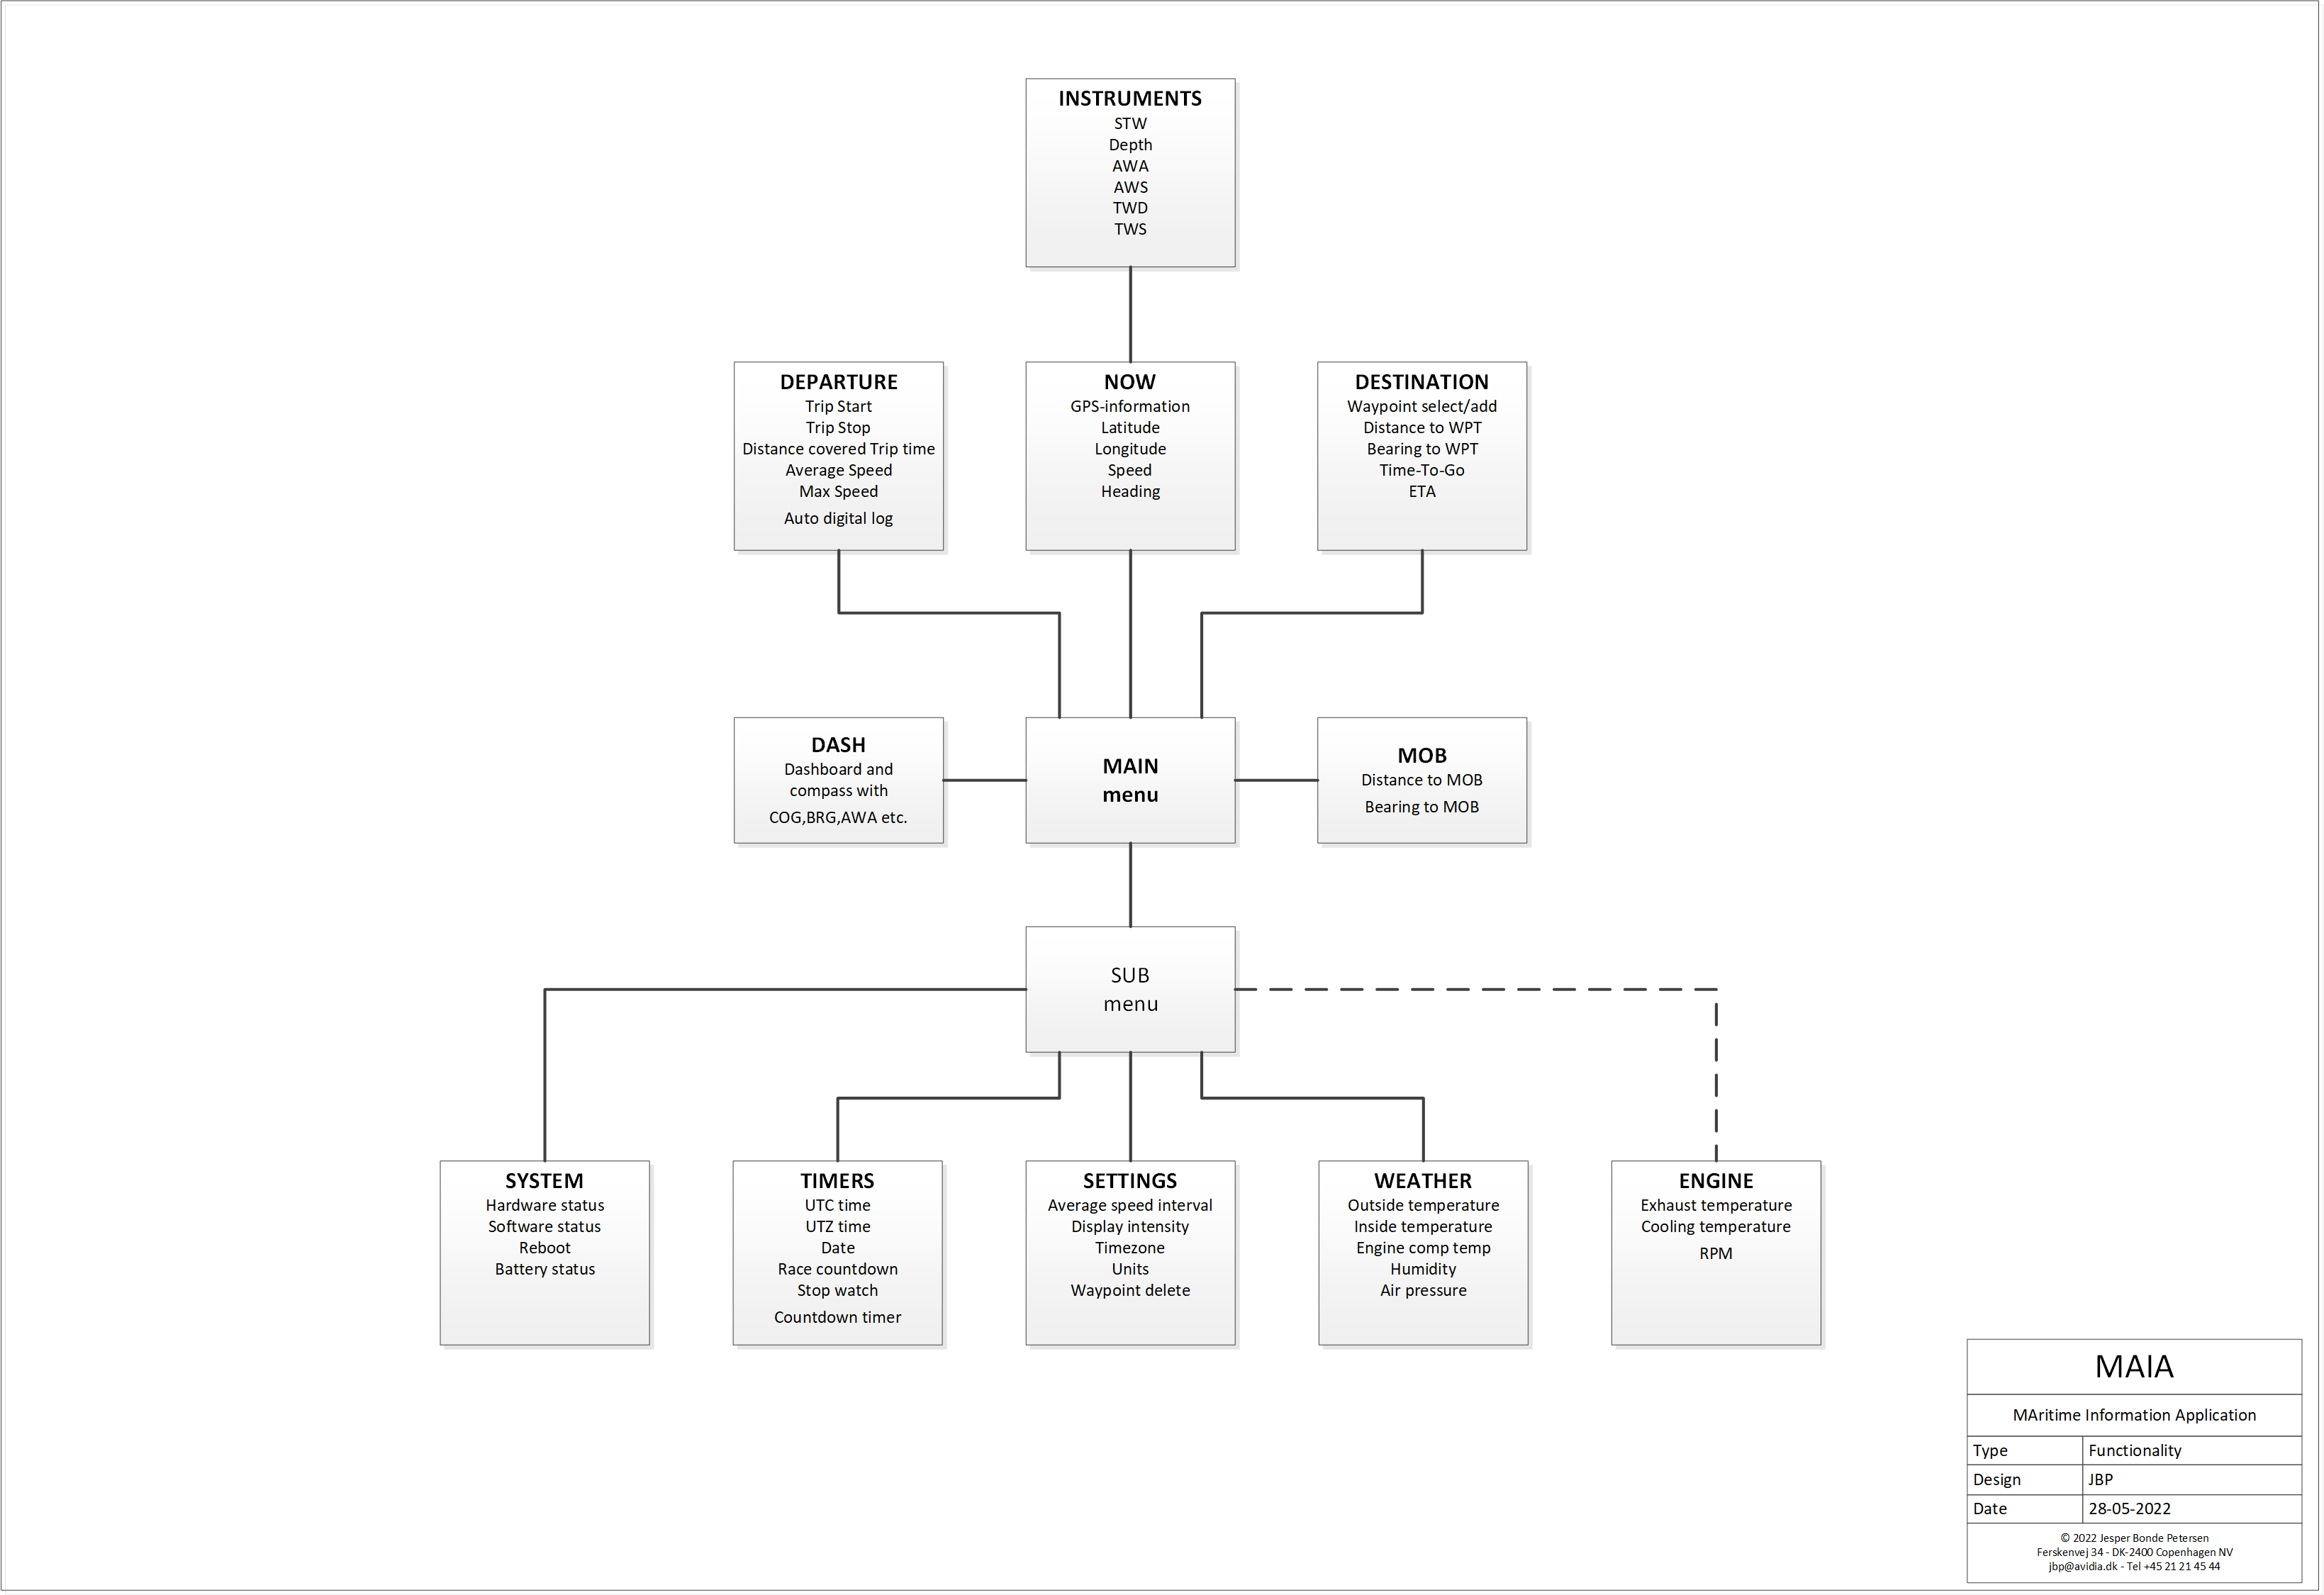
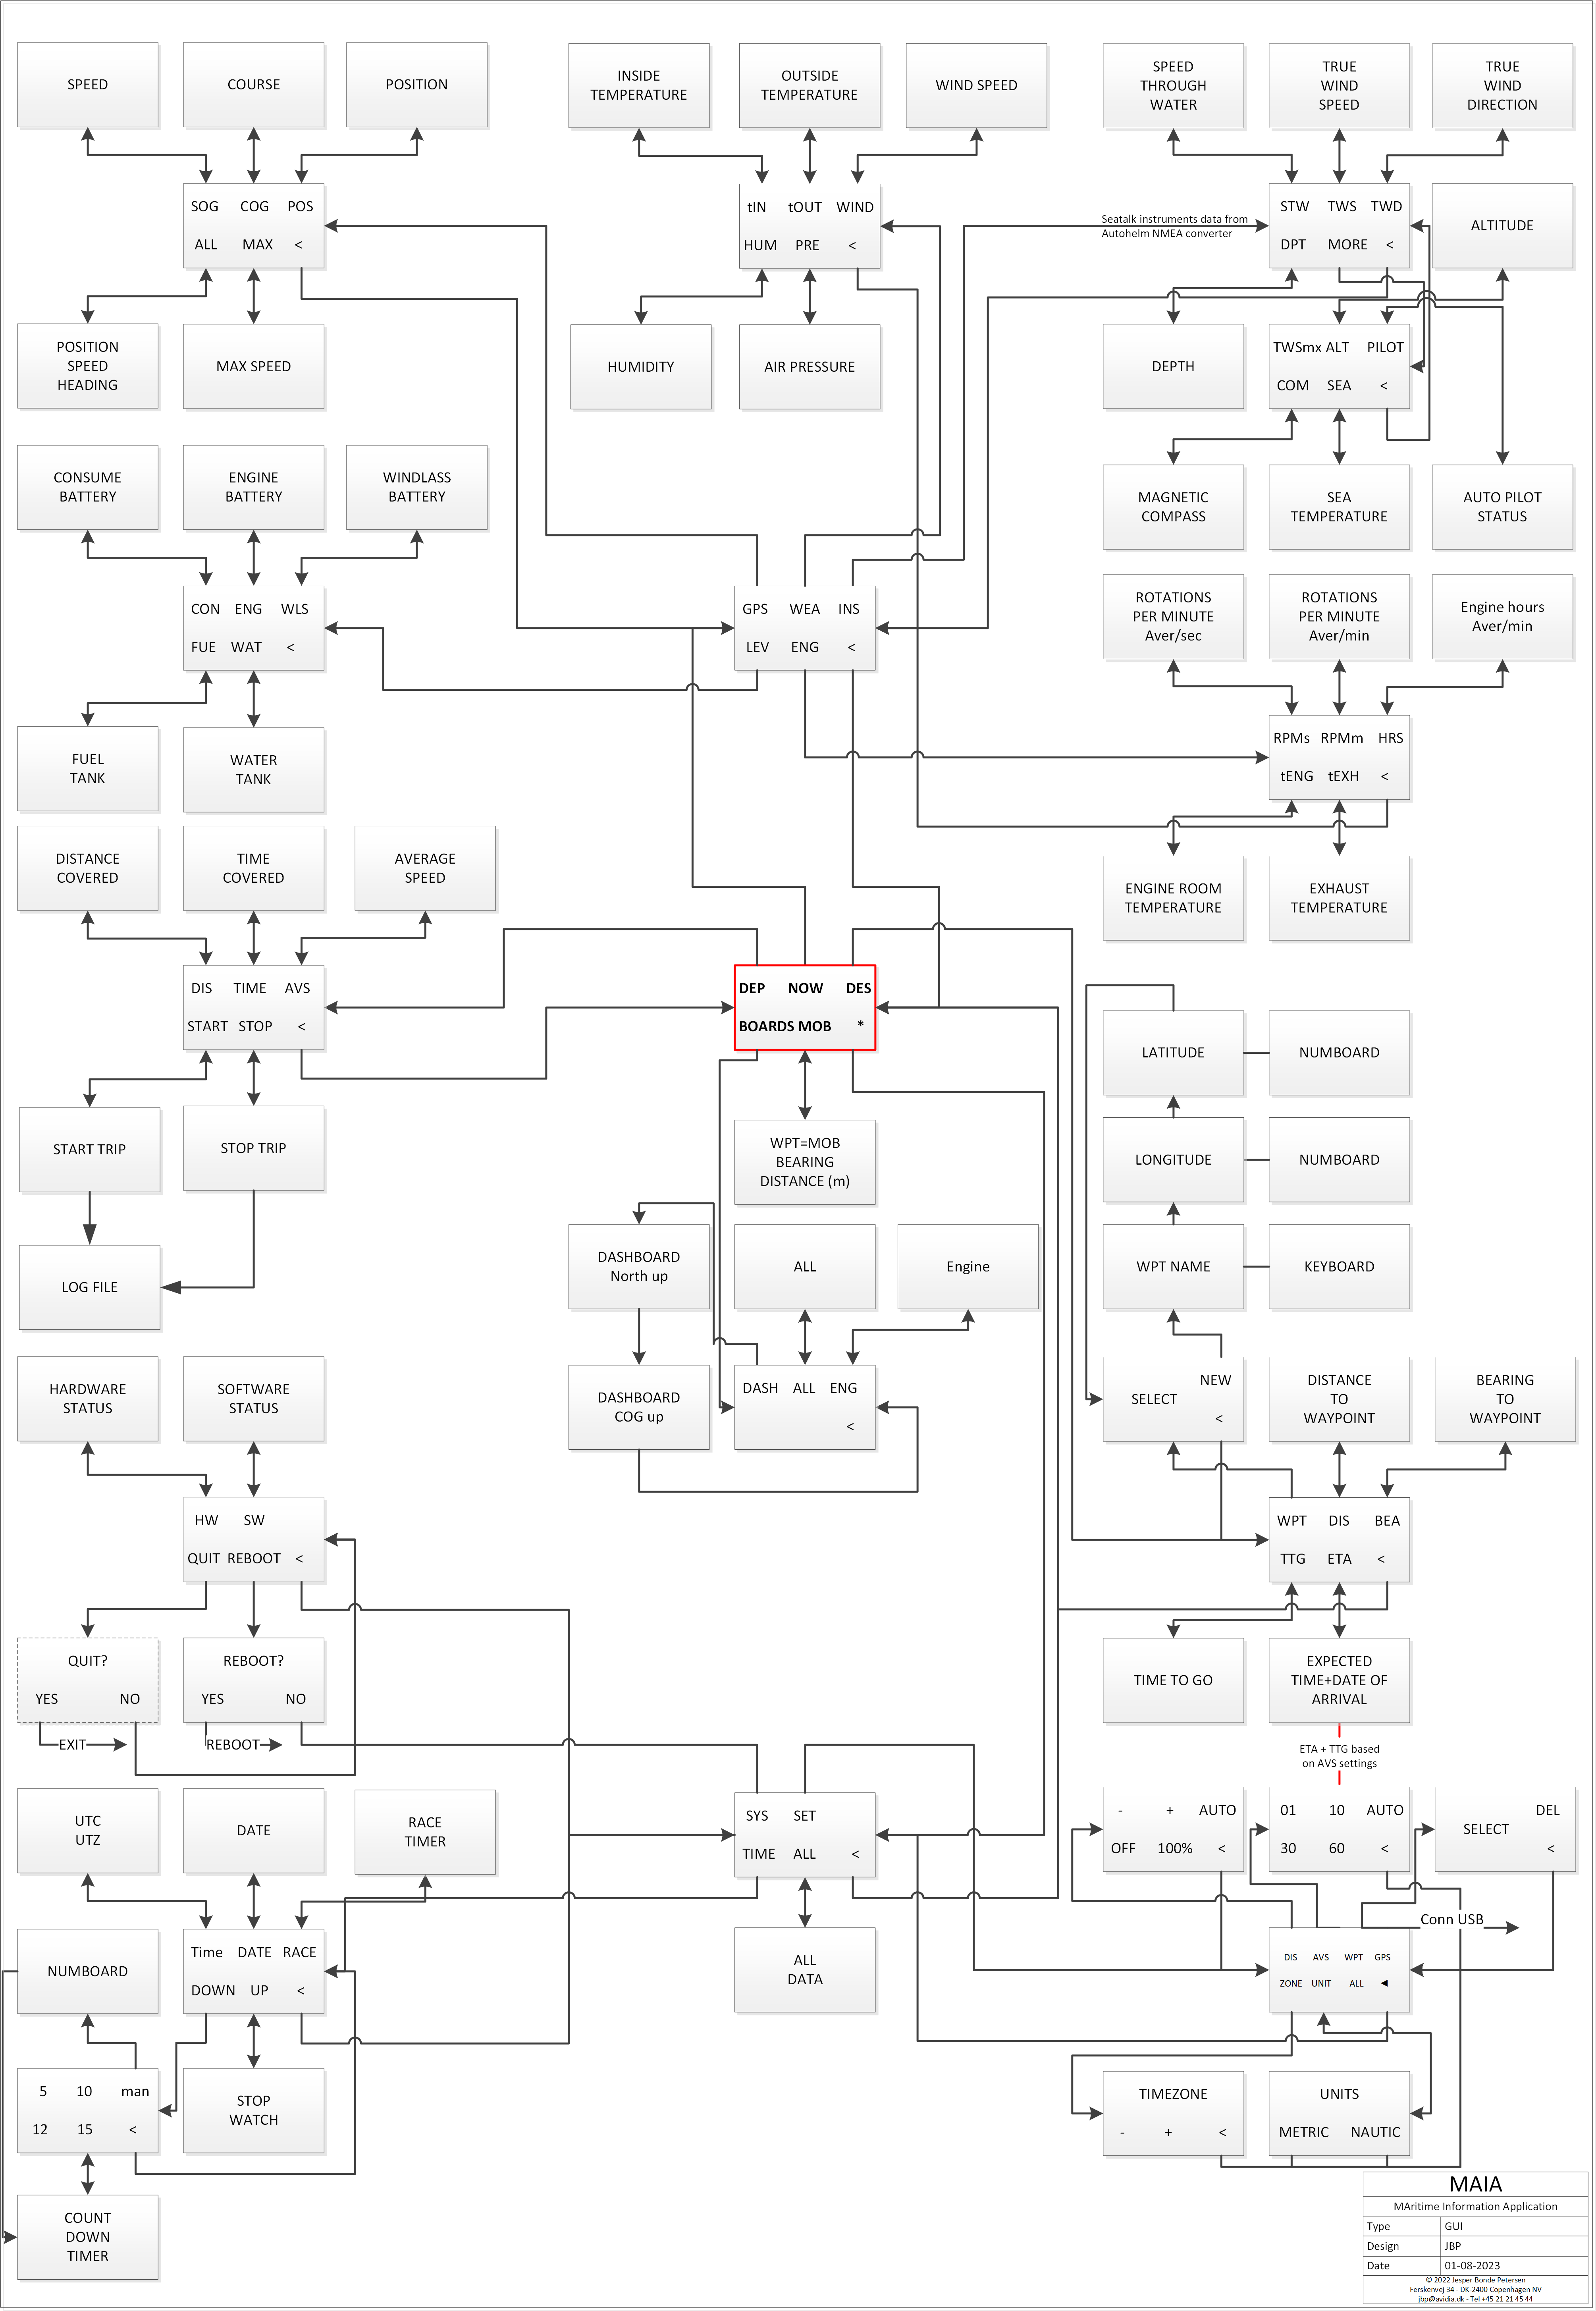
In order to use the system on Raspberry Pi touch displays like PiTFT 3.5″ or the official RPi 7″ and to ensure smooth operation in rough seas, the basic amount of buttons in menus are kept to a minimum comprising 6 choices in a 3×2 matrix. All information displayed is primarily one value at a time, but some combined views and boards are also provided if readable on the current display configuration. When data is displayed the screen works as a full size button and touching the screen will revert to the last menu as seen here where the Main Menu is the red frame:
Data acquisition
Instrument data are acquired and submitted from the MAIA server as standard NMEA-sentences via UDP. However non-standard NMEA headers like “VOL” and “WEA” were created for transmitting data from attached sensors (voltage, temperature, humidity and pressure). The data can then be picked up by clients on the same WLAN as the server in order to service as many display units as desired on board.
The system updates a CSV-file every 2 minutes containing all parameters registered. As it also converts postition to a decimal format which is Google-standard, the file can be uploaded directly to Google maps where all data can be seen for each plot. An example can be seen here
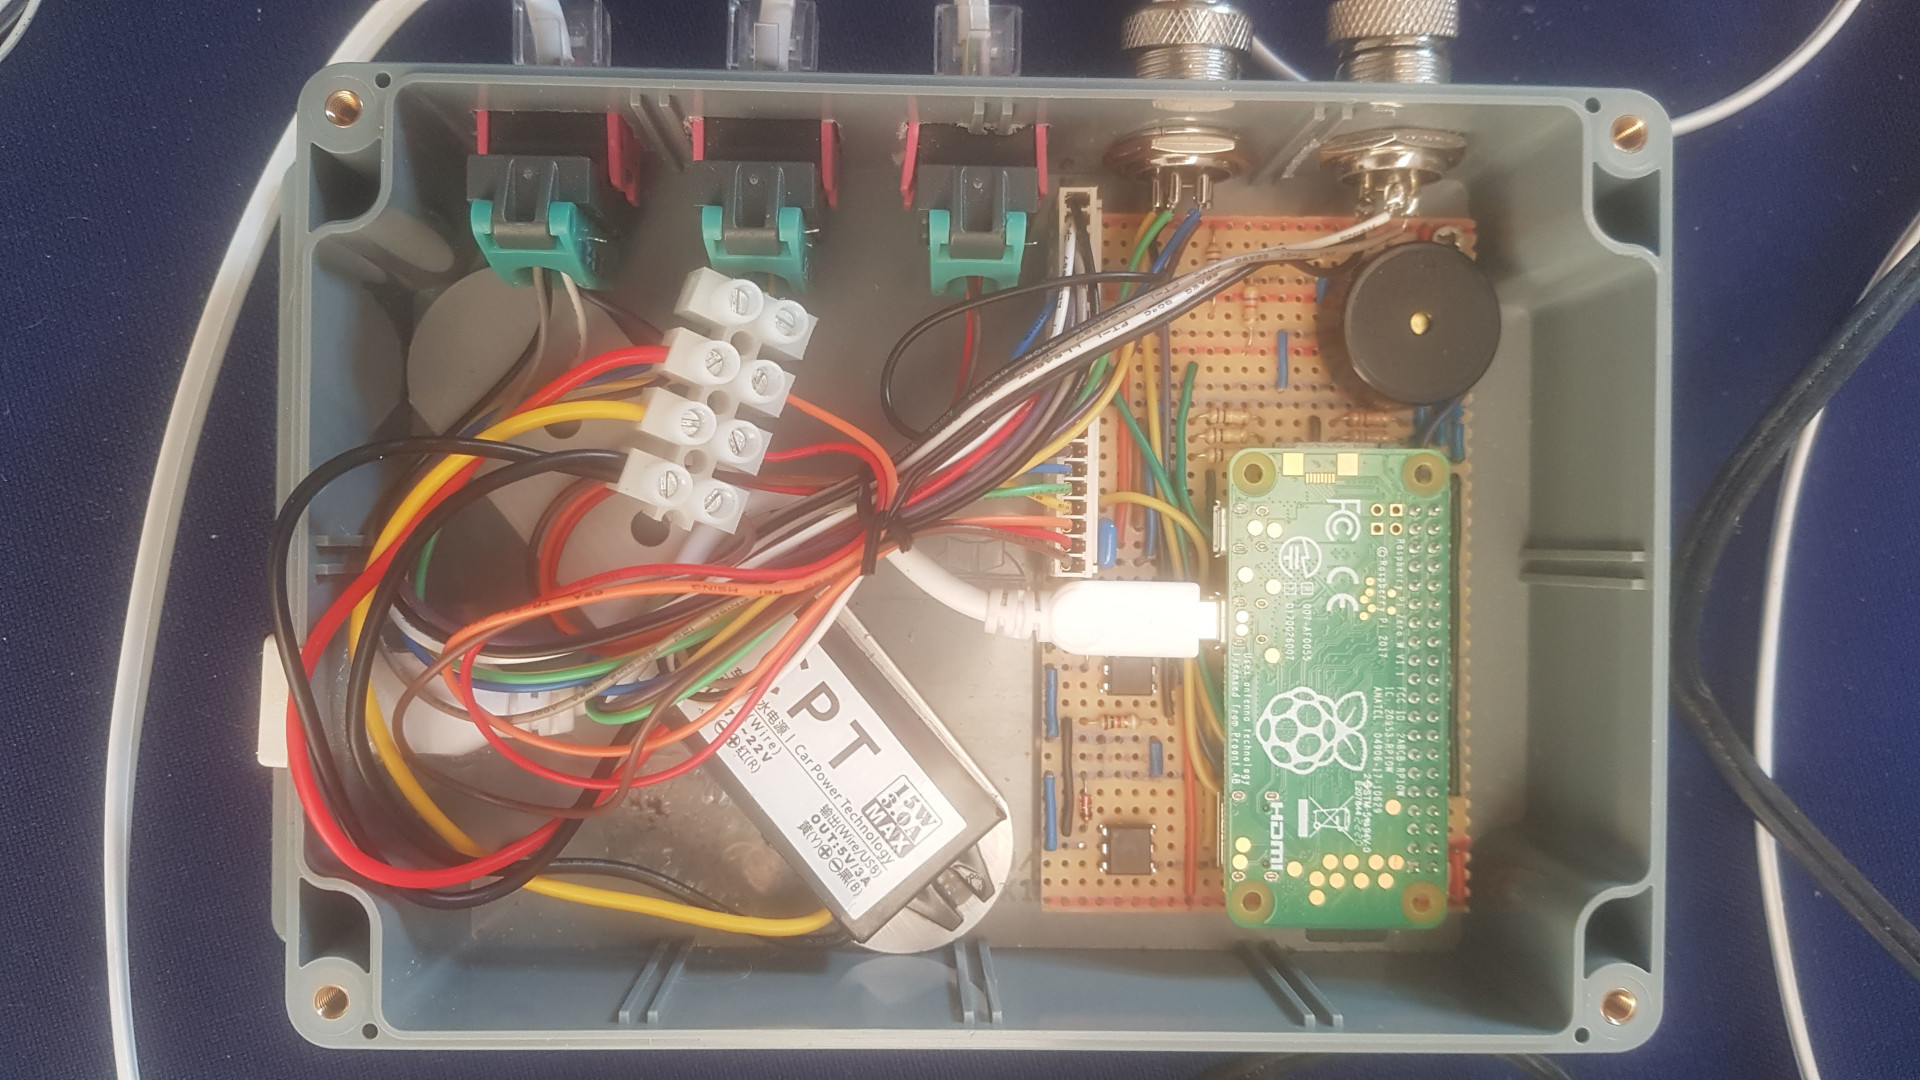
Server electronics
Some custom electronics was necessary to build in order to handle the different inputs to the server and to protect the serial feed with opto couplers etc:

Designing and building a circuit board for connecting sensors and RPi was done using a standard copper strip board so it can carry the RPi Z at the 2×20 pin connector:

Testing
For testing the MAIA application at home I developed a Python application (MAIAsimulator.py). This takes you on a virtual but realistic trip around the Danish island Anholt in a fairly stable westerly breeze. If a trip is started at one of the MAIA clients at the same time as launching the simulator you can after some time fetch a date/time stamped CSV-file which can be uploaded directly to Google maps for testing the log data that was recorded.
The system updates a CSV-file every 2 minutes containing all parameters registered. As it also converts postition to a decimal format which is Google-standard, the file can be uploaded directly to Google maps where all data can be seen for each plot. An example can be seen here
Finally I made a mobile version of MAIA that can be used on the boats WLAN with Android devices that have the Pydroid app installed. This is ideal for situations where the permanent installed devices are out of reach – eg if helming at the tiller.
WiFi
A feature uploading current position as a csv-file to a web page was created so relatives can follow the journeys. Obviously this only works when the boats network is connected and for this reason a Logitech portable router with WISP was a good choice as this automatically connects to a preconfigured mobile phone with hotspot sharing. However this solution has proved useless when out of mobile range as the local routing stops working when there is no internet connection. So an extra router was introduced for offline connection and the combination with two routers now works perfectly with a solid local connection between devices on board no matter how far away the coastline is. The webpage can be seen here https://jesperbonde.dk/elma/.